Your Statistics
CHASE's statistics page includes a personal section summarizing your own conference so far, useful for feedback conversations or just curiosity about how you did.
To open it, tap your initials in the top right and choose Statistics. Delegates and non-state actors see the My Statistics section. Spectators only see the conference-wide part.
What's tracked
- Speaking: total time spoken (with how you compare to your peers, shown as "better than X%"), number of formal speeches, number of Points of Information, average and longest speech length, and your average wait time before being called.
- Attendance: total time present and how many committees you attended (relevant if you moved between committees, e.g. as an NSA).
- Voting: how many times you voted in favor, against, or abstained, and your total votes cast.
- Activity: papers you've sponsored, amendments you've proposed, and how many of your amendments were accepted.
Reading it
Each figure only appears once there's something to show. If you haven't spoken yet, the speaking section stays hidden rather than showing zeroes everywhere.
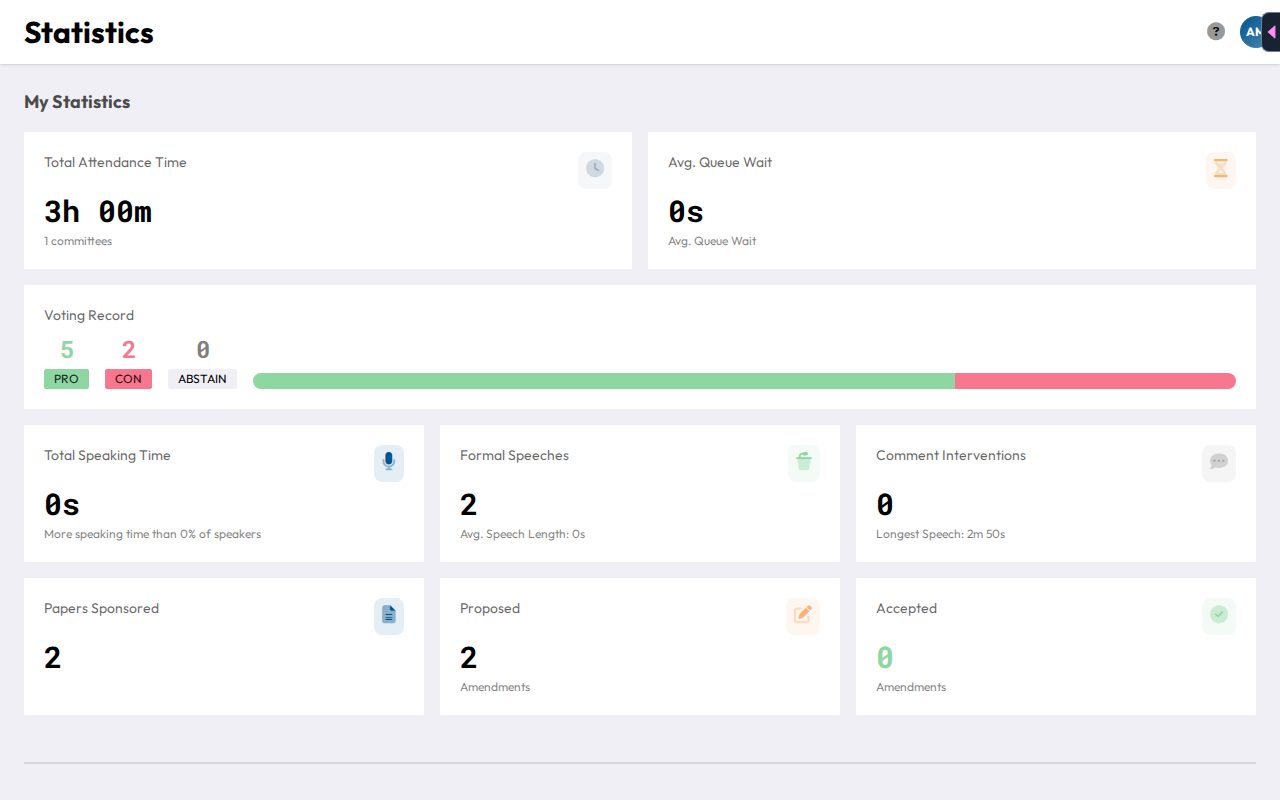
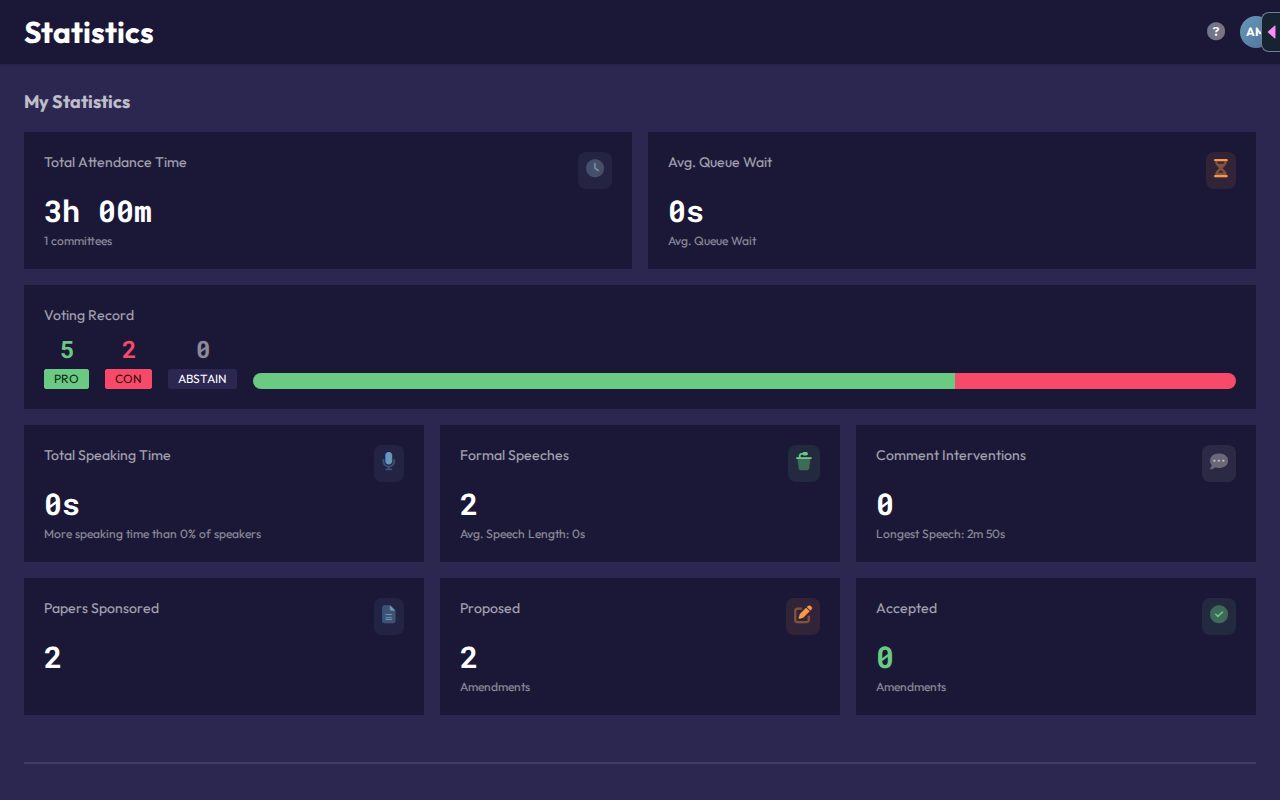
Below your personal numbers, the same page shows conference-wide charts and tables everyone can see, across the whole conference and not just your own committee:
- attendance over time
- speaking leaderboards for formal speeches and Points of Information, plus a table for non-state actors
- speaking time by region
- speaking fairness (the Gini coefficient)
- activity per committee
- voting patterns, such as the most contrarian voters and voting alignment
- amendment success rates and top paper sponsors