Statistics
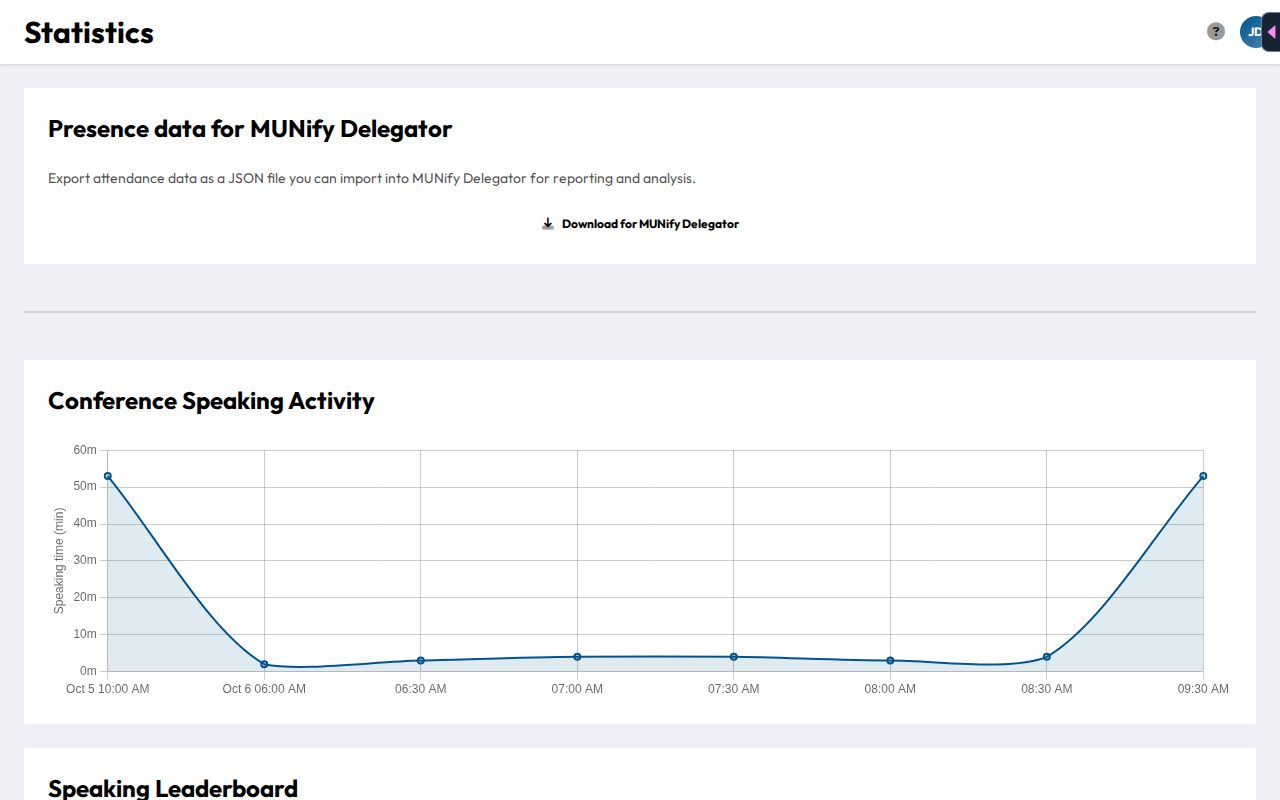
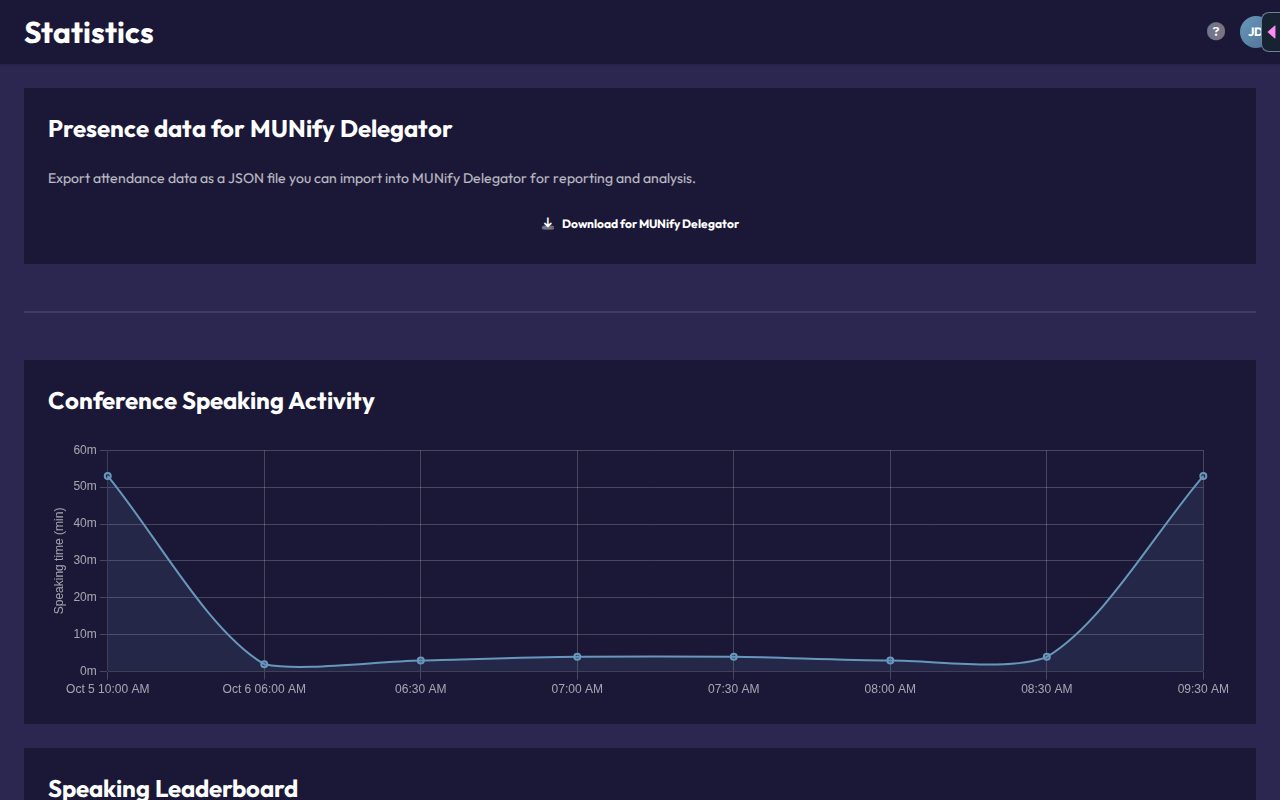
The Statistics page (avatar menu) shows conference-wide figures covering everyone. Personal statistics only appear for delegates and NSAs (see the participant Your Statistics page), so as a chair you see the conference section:
- Conference Speaking Activity: speaking over time.
- Speaking Leaderboard: toggleable between speeches and Points of Information.
- Non-State Actor Activity: the NSA leaderboard.
- Speaking by Regional Group.
- Speaking Fairness: the Gini coefficient, a fairness metric measuring how evenly speaking time is spread across delegations (a common way of quantifying inequality, borrowed from economics).
- Committee Activity.
- Most Contrarian Voters and Most Aligned Delegations: how often delegations vote against vs. with the majority.
- Amendment Success Rate.
- Top Paper Sponsors.
- Attendance Trend by Day.
These figures are conference-wide, not filtered to a single committee, useful for a Secretariat-level view as well as within your own committee. Admins additionally see Download for MUNify Delegator at the top of the page, which exports attendance for import into MUNify DELEGATOR.